Red-Wine-Classification
Red-Wine-Classification Intro and Data imbalance
In this repository I will tackle the question of outliers, feature importance and classification models.
The dataset is related to the red variant of the Portuguese “Vinho Verde” wine. For\ [Cortez et al., 2009]. Due to privacy and logistic issues, only physicochemical (inputs) and sensory (the output) variables are available (e.g. there is no data about grape types, wine brand, wine selling price, etc.).
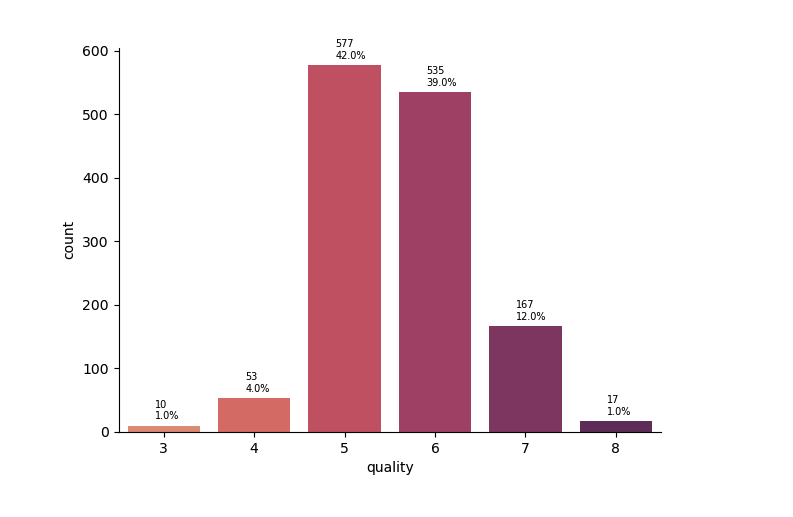
In an example of imbalanced dataset like this one we have to ask ourselves: do we want our classifier to perform better for majority or minority classes?
Classes 3,4 and 8 account to only 6% of data. In our case data oversampling would not be approrpiate as majority of wines on the market are greaded as 5,6,7. Smaller number of wines are of very low or very high quality.
So, when building our models we have to have this in mind.
I will train my models on two data sets. The first dataset will have the original “quality” column with classes from 3-8.
The second dataset will have transformed “quality” column with categories “average” and “good”.
Outliers
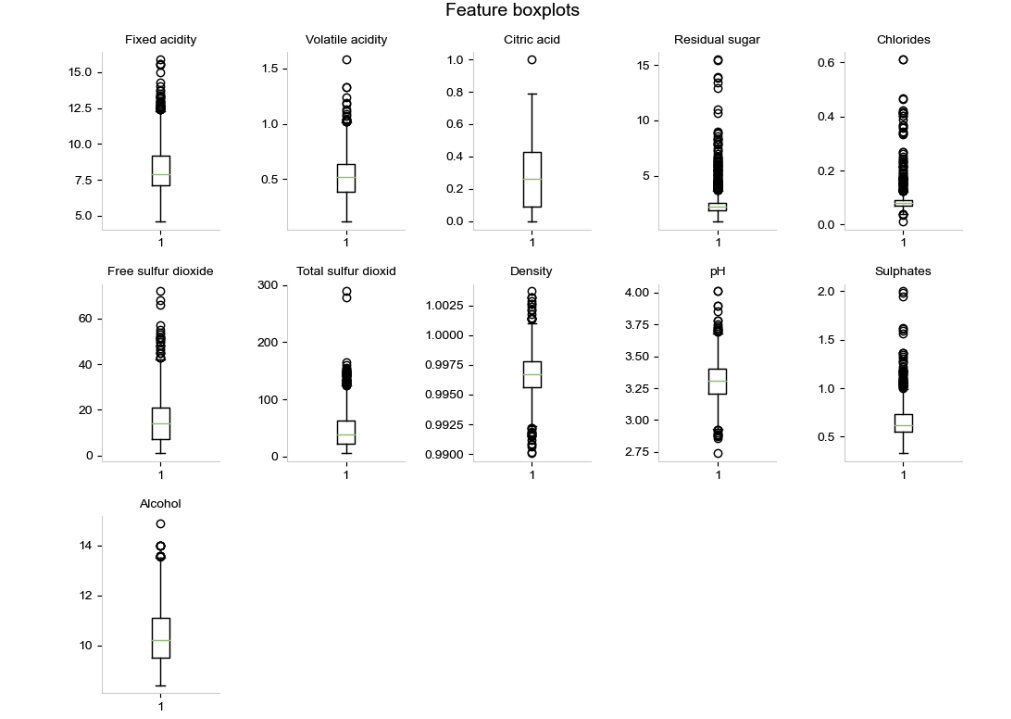
From box-plots above one could conclude that features have significant number of outliers. But if we think of the data we have, they don’t have to be necessarily outliers. Since wine making is a process it could be that those wines were not produced up to standards, or that the grape variety was not of good quality, or that the year was not very good year for that grape variety etc… After soem research I found out that some of those aparent outlier values could actually be valid.
So I will try to apply LocalOutlierFactor. The local outlier actually sounds like an appropriate solution over here.
The local outlier factor uses distance to neighbours to calculate density. As it’s stated in sklearn,by comparing the local density of a sample to the local densities of its neighbors, one can identify samples that have a substantially lower density than their neighbors. Which menas we actually asses how isolated is the sample and based on that we potentially reject is as an outlier.
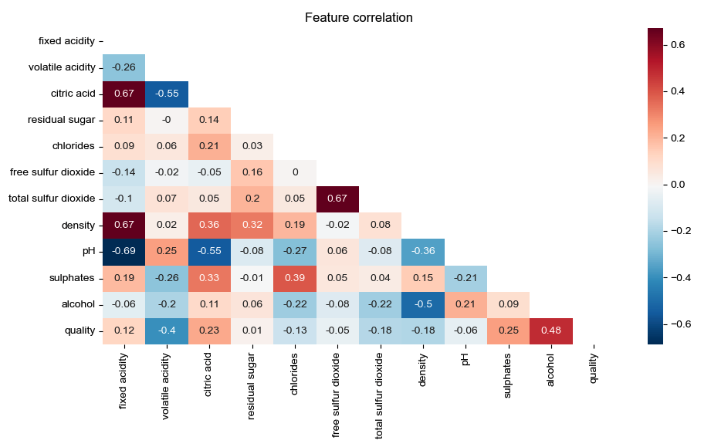
Feature selection
For the first dataset with original quality categories features were choosed using OLS method for backward selection.
For the second dataset I decided to use the correlation matrix and choose the most relevant values looking at the correlation and multicolinarity of features.
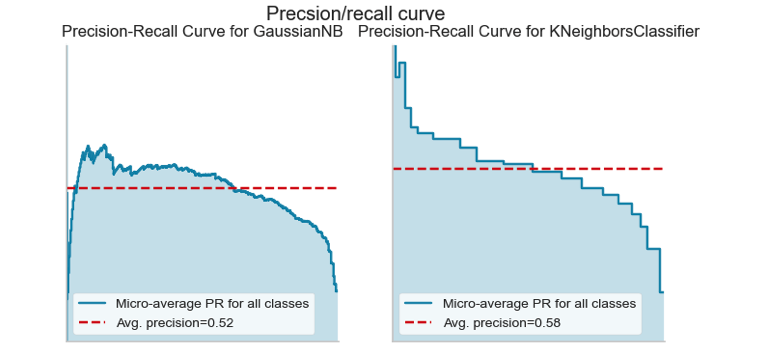
Classification models and metrics
I trained Naive Bayes, KNN, Logistic Regression, SVC,Decision trees and Random Forest. Classification models performace was evaluated using precision-recal score (in the first case especially) and roc-auc score(in the secodn case because I had more balanced data).
For the first set Naive Bayes and KNN had the best precision/recall score.
For the second set Naive Bayes and Logarithmic regression slightly outperformed KNN and Suport Vector Classifier. The roc-auc score for NB and Log.Regr was 0.81 for the test data , and precision/recall was around 75%.

Further considerations
Possible way to address the problem of minority classes would be to perform detailed analysis of features on those classes or to join classes 3 and 4 and 7 and 8 possibly.